Researching the Foundations of an E‑Commerce Design System
Usability research for Fırat Teknokent's R&D e-commerce design system, benchmarked on gratis.com.
- Role
- UX Researcher (solo)
- Project
- Things × Fırat Teknokent
- Timeline
- Nov – Dec 2025
- Platform
- Desktop web
Methods · Remote moderated usability testing · Think-aloud · User interviews · SUS · SEQ · Affinity mapping
88.5SUS (System Usability Scale) score, an A+
0/5participants found the CTA
74%tasks fully completed
8avg. clicks to filter by price
Client project
Research
SoloR&D project5 participants
The question
How do common e-commerce components perform for real users?
- 1An R&D team was building a modular design system for Turkish e-commerce.
- 2Before standardizing, they needed evidence from real users.
- 3The system didn't exist yet, so I used gratis.com as a benchmark: filters, product cards, CTAs, navigation, forms.
Method
Moderated usability testsRemote, with think-aloud
5 participantsAged 21–48, with mixed levels of digital literacy
11 tasks, measuredTime, clicks, errors, first-click, SEQ, SUS
Tasks grouped byUsability & effectivenessPerceived experience & satisfactionDiscoverability & learnability
I paired task metrics with SUS on purpose: satisfaction alone can hide problems.
My role
- Owned the whole project, from research protocol to final report.
- Moderated all 5 sessions, with think-aloud.
- Analyzed task metrics and clustered think-aloud data into 10 themes.
Findings
They rated it A+. None of them found the CTA.
What they said · SUS (System Usability Scale)
088.5 · A+100
What they did · found the CTA
0 / 5 participants
ObservedCTA visibilityOn the page, but 5 of 5 missed it. It needs visual weight, contrast and position.
ObservedFilter vs. mental modelThe price filter used the original price; users saw the discounted one. Avg. 8 clicks (SD 3.67).
ObservedCart lost after sign-upSigning up mid-purchase emptied the cart and sent users to the homepage.
ObservedSearch without helpNo auto-complete or suggestions: one participant couldn't spell “waterproof” and never found the product.
Insights
10 themes from think-aloud data
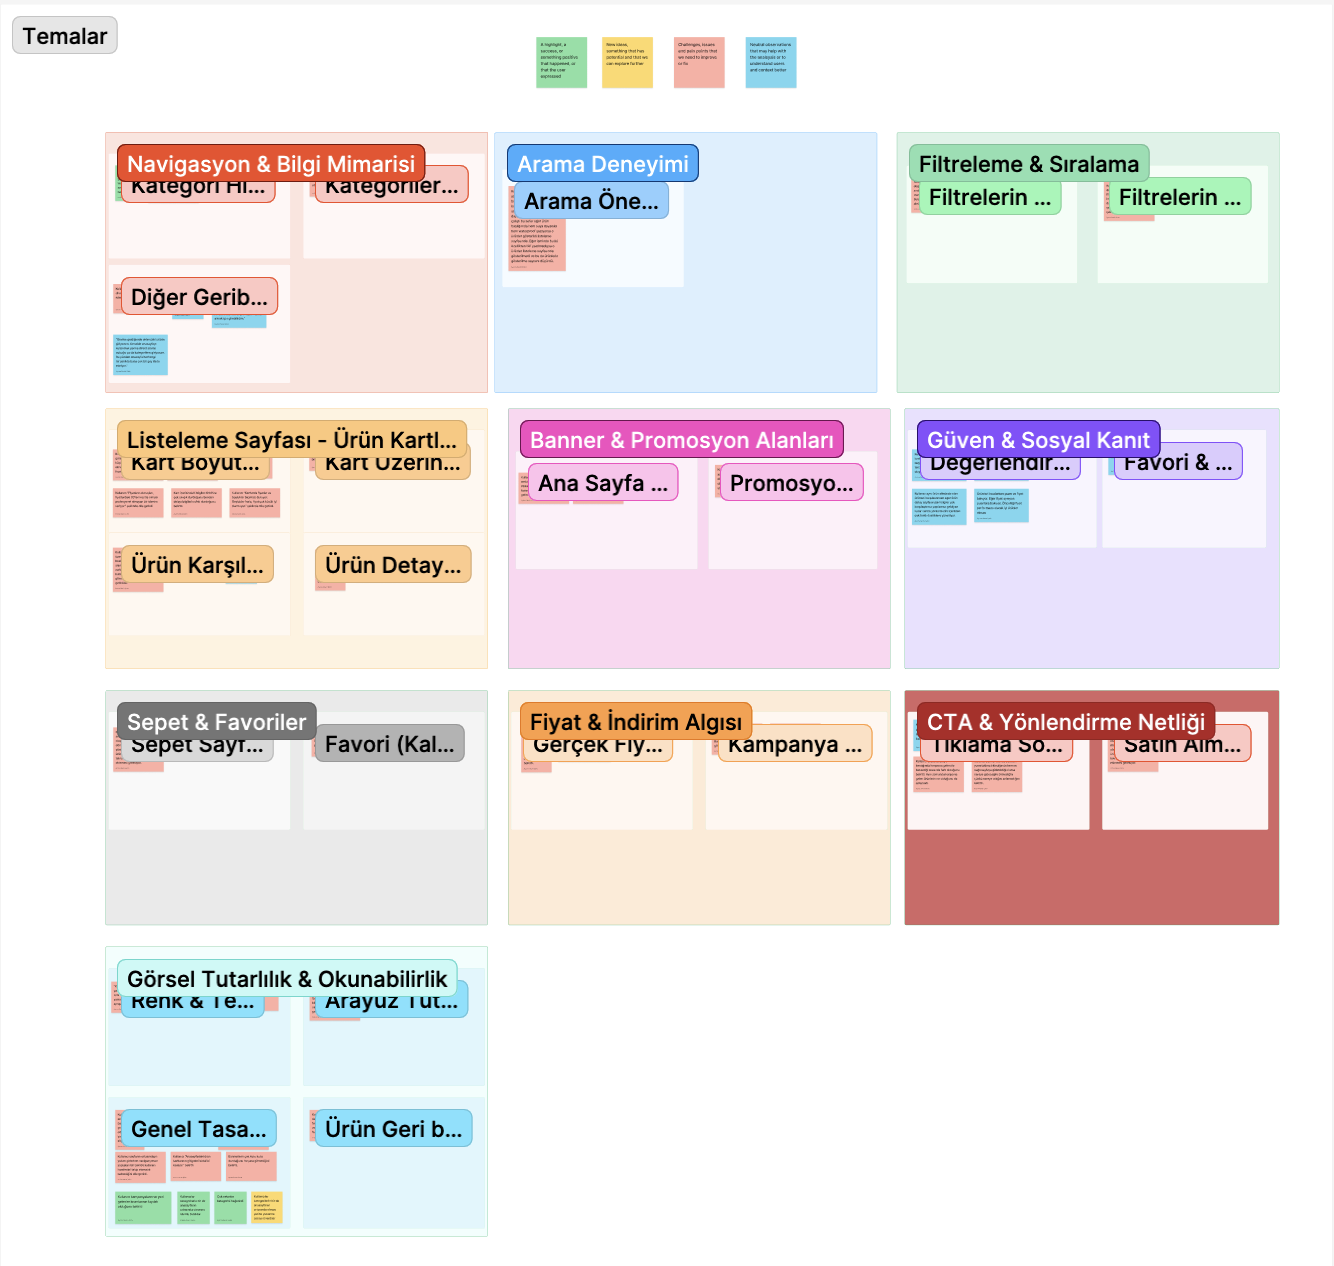
Built for expertsFrequent shoppers coped; less experienced users struggled with filters, search and abstract labels like “smart sorting”.
Visible ≠ understoodPromotions were noticed but not understood.
Ratings drive trustWhen comparing, participants looked at ratings first.
Accessibility riskDense cards and small type: participants leaned in to read products.
Reflection
What I learnedA high SUS score doesn't mean a smooth experience. That's why I combined satisfaction with task data.
LimitationA small sample of 5, tested on desktop although most people shop on mobile.